Skip to content
INDOPHILE

Archaeogenetics & Ancient DNA

What the DNA says — and what it cannot.

Ancient genomes have transformed the study of South Asia's population history. They are also easy to misread. This section presents the evidence study by study, with its methods and limits in plain view.

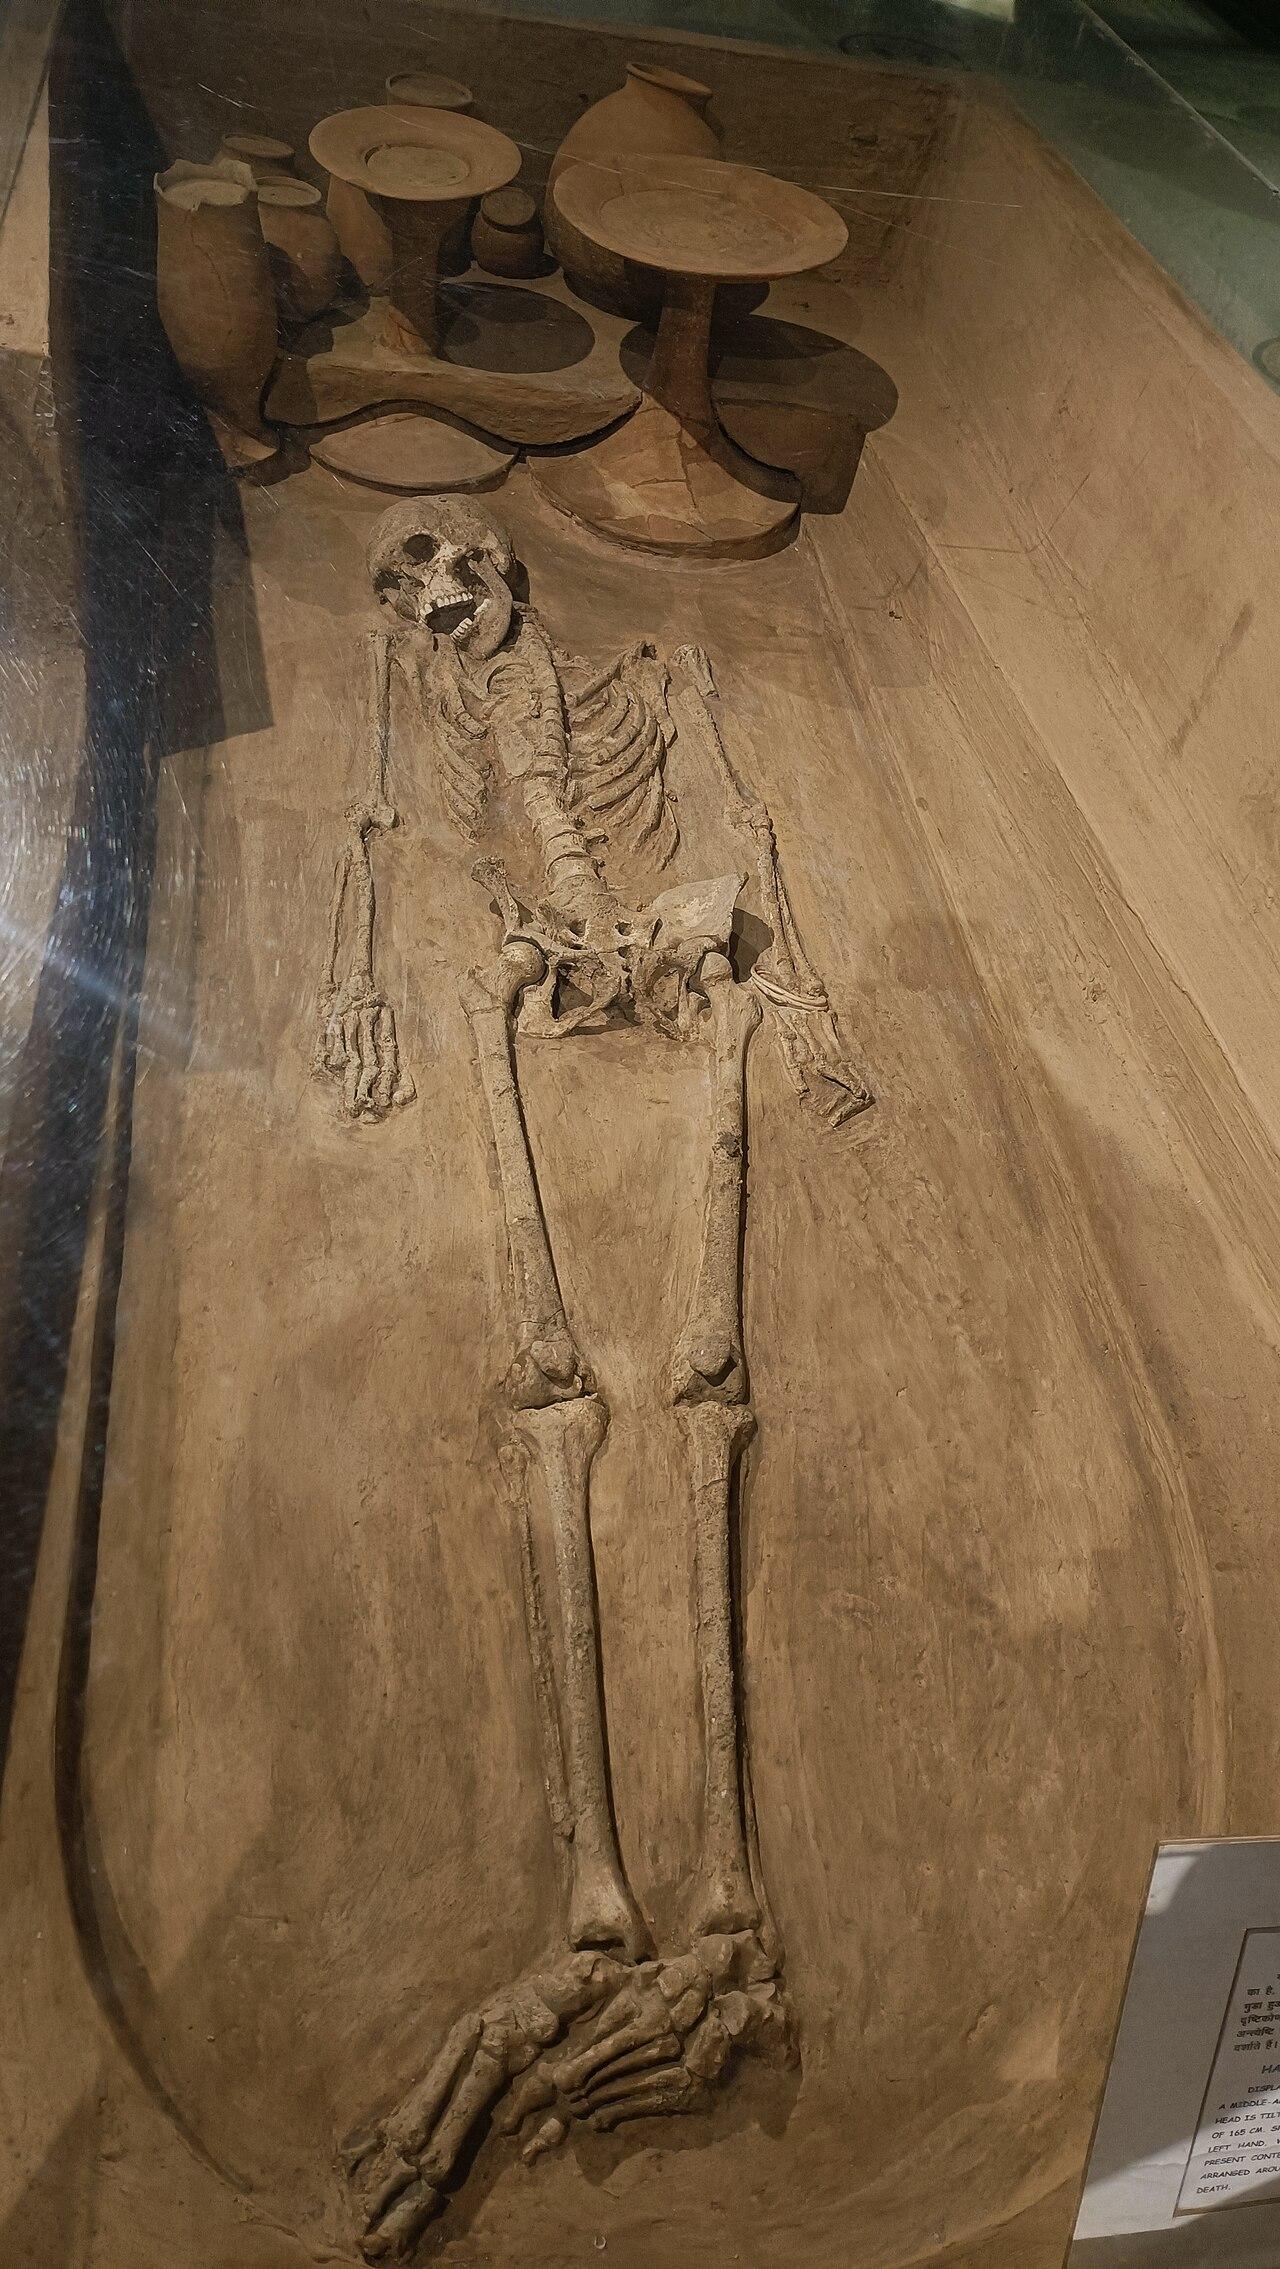
A Mature Harappan burial at Rakhigarhi, the cemetery that produced the first published Indus-associated genome.
A Mature Harappan burial at Rakhigarhi, the cemetery that produced the first published Indus-associated genome.Photo: Aadrit28 · CC BY-SA 4.0 via Wikimedia Commons
  • Ancestry is not identity

    Genetic ancestry is never equivalent to ethnic, linguistic, religious, caste or national identity.

  • No unchanged descendants

    No present-day community is the direct, unchanged descendant of a single ancient population.

  • Observed vs. modelled

    We mark whether a claim comes from sequenced ancient individuals or from statistical models.

  • No invented numbers

    We do not re-plot ancestry percentages. Proportions are model-dependent; we link to the study instead.

Interactive model

How published models combine ancestry

A map of relationships, not proportions. Solid links are seen in sequenced ancient individuals; dashed links are statistical models.

Ancestry model diagram for South Asian population historyQualitative diagram: AASI-related and Iranian-related ancestry combine in the Indus Periphery group; Indus Periphery combines with AASI to form the ASI model, and with steppe-related ancestry to form the ANI model; present-day populations fit as ANI–ASI mixtures. No proportions are shown.AASI-relatedUnsampled; inferredIranian-relatedEarly-diverging lineageSteppe-relatedSwat valley, 2nd mill. BCEIndus Periphery12 ancient individualsASIStatistical constructANIStatistical constructPresent-day South Asian populationsA continuous cline, shaped further by endogamy

Legend

Observed directly in ancient genomes

Statistical model / inference

Population with sequenced individuals

Modelled construct, never sampled

Hover or focus a box to see how each link is supported.

No admixture proportions are drawn here. Published proportions vary by group and by model; see each study for its own figures. Why we do this.

Specimen database

Ancestry calculator

Each ancient individual, published group or modelled population, with the ancestry models its study fitted and its physical profile. Every figure is transcribed from the publication with its location cited; where a source gives no number, none is shown.

Individual

I6113 — Rakhigarhi

Rakhigarhi cemetery, Haryana, India

c. 2800 – 2300 BCE (Mature Harappan cemetery; bone collagen too poorly preserved for direct dating) · dated by archaeological context

Site: Rakhigarhi →

Ancestry model

Model A — Iranian-plateau herder-related + Andamanese hunter-gatherer proxy (for AASI)

73%
27%
  • Iranian-related (western Zagros herder proxy)73% ± 6
  • AASI-related (Andamanese hunter-gatherer proxy)27% ± 6derived (1 − reported)

Fit p = 0.103 · Shinde et al. 2019, Results (qpAdm modelling)

Model B — Iranian-plateau herder-related + East Siberian hunter-gatherer proxy

63%
37%
  • Iranian-related (western Zagros herder proxy)63% ± 6
  • East Siberian hunter-gatherer-related proxy37% ± 6derived (1 − reported)

Fit p = 0.24 · Shinde et al. 2019, Results (qpAdm modelling)

Steppe pastoralist-related ancestry
Significantly depleted relative to present-day South Asians (p = 0.018, two-sided Z-test)
Shinde et al. 2019, Results
Contamination screen
Consistent with an uncontaminated female after filtering (Y/(X+Y) ratio 0.026)
Shinde et al. 2019, STAR Methods

Only these two two-way models fitted. The second source is a proxy for deeply diverged South/East Asian-related ancestry; the authors note the hunter-gatherer share is smaller than in present-day groups. With one low-coverage genome, the standard errors are wide.

Method
Genome-wide in-solution capture; qpAdm two-way models
Coverage
31,760 SNPs covered at least once after filtering (208,111 before filtering); 108 libraries from 5 extractions of petrous bone
mtDNA
U2b2
Sex
Female — genetic determination, consistent with the anthropological one

Physical profile

Stature
Not reportedNot reported in the genetic study
Build
Not reported
Bone density
Not reported
Teeth
Not reported
Pathology
Not reported
Pigmentation
Not inferable at this coverage

Burial RGR7.3, BR-01, HS-02, with Harappan grave goods. The genetic study reports no stature or other skeletal measurements; the excavators' cemetery report would be the source for these.

Model, not measurement. An ancestry proportion is the output of a statistical model with chosen source populations. Change the sources and the numbers change.

Where the numbers come from. Every figure is transcribed from the publication, with its location cited under the bar. A value marked “derived” is 1 minus a reported figure; a range covers several individuals; “≥” is a published minimum. Where a source gives no number, none is shown.

Not an identity. No result here corresponds to an ethnic, caste, linguistic, religious or national group, past or present.

Geography of the evidence

Where ancient individuals were sampled

Most of the subcontinent has no published ancient genomes. The map shows how thin — and how geographically skewed — the direct evidence still is.

Loading atlas…

Points: published sampling locations. Dotted green lines: schematic ancestry flows (not migration paths). Selecting a point opens its study.

Research database

The studies

YearStudyEvidence typeSampleClassification
2009Reconstructing Indian population history

Reich, D., Thangaraj, K., Patterson, N., Price, A. L. & Singh, L. · Nature

Present-day DNA modelling132 individuals from 25 groupsWell supported
2013Genetic evidence for recent population mixture in India

Moorjani, P. et al. · American Journal of Human Genetics

Present-day DNA modelling73 groupsWell supported
2017A genetic chronology for the Indian Subcontinent points to heavily sex-biased dispersals

Silva, M. et al. · BMC Evolutionary Biology

Present-day DNA modelling—Debated
2019The formation of human populations in South and Central Asia

Narasimhan, V. M. et al. · Science

Ancient DNA + modellingGenome-wide data from 523 ancient individualsWell supported
2019An Ancient Harappan Genome Lacks Ancestry from Steppe Pastoralists or Iranian Farmers

Shinde, V. et al. · Cell

Direct ancient DNA1 individual (I6113) with usable dataWell supported

Concepts

A careful glossary

Statistical construct

AASI-related ancestry

A modelled ancestry component distantly related to present-day Andamanese and other East Asian and Australasian lineages, inferred as a deep source in South Asian populations.

What it is — and isn't

Well supported

No ancient genome assigned purely to AASI has been sequenced. It is inferred statistically as an unsampled source population. It does not correspond to any present-day community, language family or caste.

SourcesNarasimhan et al. 2019

Observed in ancient genomes

Indus Periphery-related ancestry

A genetic gradient defined by individuals with Iranian-related and AASI-related ancestry, observed directly in ancient genomes from Rakhigarhi and from Indus-associated migrants found in Iran and Central Asia.

Observed in a handful of people

Well supported

The cline is defined by twelve published individuals — eleven found outside the Indus region and one at Rakhigarhi. It is direct evidence of these individuals' ancestry. Extending it to the population of the civilisation is an inference.

SourcesNarasimhan et al. 2019; Shinde et al. 2019

Statistical construct

ANI and ASI

Two statistical reference populations proposed in 2009 to describe the main axis of genetic variation among present-day Indians.

A model, not two peoples

Well supported

ANI and ASI were never sampled; they are mathematical constructs. Later ancient-DNA work showed each was itself a mixture. They should not be mapped onto north/south, caste, language or any present-day identity.

SourcesReich et al. 2009; Narasimhan et al. 2019

Statistical construct

Endogamy and population structure

Marriage within a group over many generations produces genetic structure — strong founder effects that are visible in genomic data.

A genetic signature of social practice

Well supported

Strong founder events in many South Asian groups indicate long-term endogamy. Genetics can detect the pattern and estimate when mixing declined; it cannot explain the social institutions behind it.

SourcesReich et al. 2009; Moorjani et al. 2013

Statistical construct

Haplogroups and uniparental lineages

Maternal (mtDNA) and paternal (Y-chromosome) lineages trace a single line of descent each — useful for sex-biased history, but a tiny part of anyone's ancestry.

One line among thousands

Established

Going back ten generations, a person has up to 1,024 ancestors but inherits mtDNA from only one of them and, if male, a Y chromosome from only one. Haplogroups should never be treated as an ethnic label.

SourcesSilva et al. 2017

Observed in ancient genomes

The Indo-Aryan migration

The model that Indo-Aryan languages entered South Asia from Central Asia in the 2nd millennium BCE, carried by people with steppe-related ancestry who mixed with existing populations — not an 'invasion' or a single event.

The Historical Record

The linguistic evidence

Well supported

Inscriptions, texts, coins and other primary sources

Vedic Sanskrit is closely related to Avestan and, more distantly, to the other Indo-European languages of Europe and West Asia. A treaty of the Mitanni kingdom in northern Syria (c. 14th century BCE) invokes the gods Mitra, Varuna, Indra and the Nasatyas, showing Indo-Aryan speech in West Asia at that time.

Most historical linguists conclude that Indo-Aryan developed outside South Asia and arrived in the 2nd millennium BCE.

SourcesWitzel 1995; Anthony 2007; Bryant 2001

What the DNA Says

What the DNA says

Well supported

What archaeogenetics can tell us — and its limits

Steppe-related ancestry is absent from the published Indus Periphery genomes and from the Rakhigarhi individual, but present in Swat valley individuals by the late 2nd millennium BCE. Today it is found across South Asia in varying proportions — a pattern that, like all ancestry, says nothing about anyone's identity, community or status.

DNA shows movement and mixture of people. It does not on its own show which language anyone spoke; the link to Indo-Aryan is an inference from matching timing and geography.

SourcesNarasimhan et al. 2019; Shinde et al. 2019

From the Trenches

Archaeological correlates — all debated

Debated

What does the archaeological evidence reveal?

No single pottery type or burial custom marks the arrival of Indo-Aryan speakers. Candidates discussed in the literature include the BMAC, the Swat graveyards, the horse and camel at Pirak, Cemetery H at Harappa, the Sinauli burials and the Painted Grey Ware culture of the later Vedic heartland. Each is debated.

The older idea of a violent 'Aryan invasion' that destroyed the Indus cities is not supported: the cities declined centuries earlier, and the skeletons once cited as massacre victims come from different periods.

SourcesBryant 2001; Parpola 2015; Possehl 2002

What We Still Don't Know

Competing views

Debated

Unresolved questions and competing interpretations

'Indigenist' or 'Out of India' proposals argue that Indo-Aryan originated in South Asia and spread outward. They are argued in a substantial literature but have little support among historical linguists and are difficult to reconcile with the ancient-DNA evidence published so far.

SourcesBryant 2001

Statistical construct

Austronesian maritime contacts

Austronesian-speaking seafarers from Island Southeast Asia crossed the Indian Ocean by the 1st millennium CE, settling Madagascar and leaving traces in South Asian boats, crops and vocabulary.

What the evidence shows

Well supported

The clearest case is Madagascar, whose language is Austronesian and whose people carry substantial Southeast Asian ancestry. In South Asia the evidence is subtler: outrigger boat designs on the Coromandel coast and in Sri Lanka, Southeast Asian loanwords, and crops and animals that moved across the Bay of Bengal.

This was a network of contacts over centuries rather than a single migration into the subcontinent.

SourcesHoogervorst 2013; Fuller et al. 2011; Pierron et al. 2017

What We Still Don't Know

What we still don't know

Hypothesis

Unresolved questions and competing interpretations

Whether Austronesian seafarers settled anywhere in South Asia itself, and how far their routes passed through Sri Lanka and South India on the way to Africa.

SourcesHoogervorst 2013

Statistical construct

Austroasiatic (Munda) ancestry

Munda-speaking groups of eastern and central India speak Austroasiatic languages related to those of mainland Southeast Asia, and carry ancestry from a related East/Southeast Asian source mixed with South Asian ancestry.

What the DNA Says

What the DNA says

Well supported

What archaeogenetics can tell us — and its limits

Studies of present-day Austroasiatic speakers find a component shared with Southeast Asian populations, contributed disproportionately through the paternal line, mixed with local South Asian ancestry. Estimated dates of the mixture vary between studies and models.

SourcesChaubey et al. 2011; Tätte et al. 2019

What We Still Don't Know

What we still don't know

Debated

Unresolved questions and competing interpretations

When and by which route Austroasiatic languages arrived, and how this relates to the spread of rice farming in eastern India. No relevant ancient genomes from the region have been published.

SourcesChaubey et al. 2011